Core Equity Commentary 1Q24
Market Summary
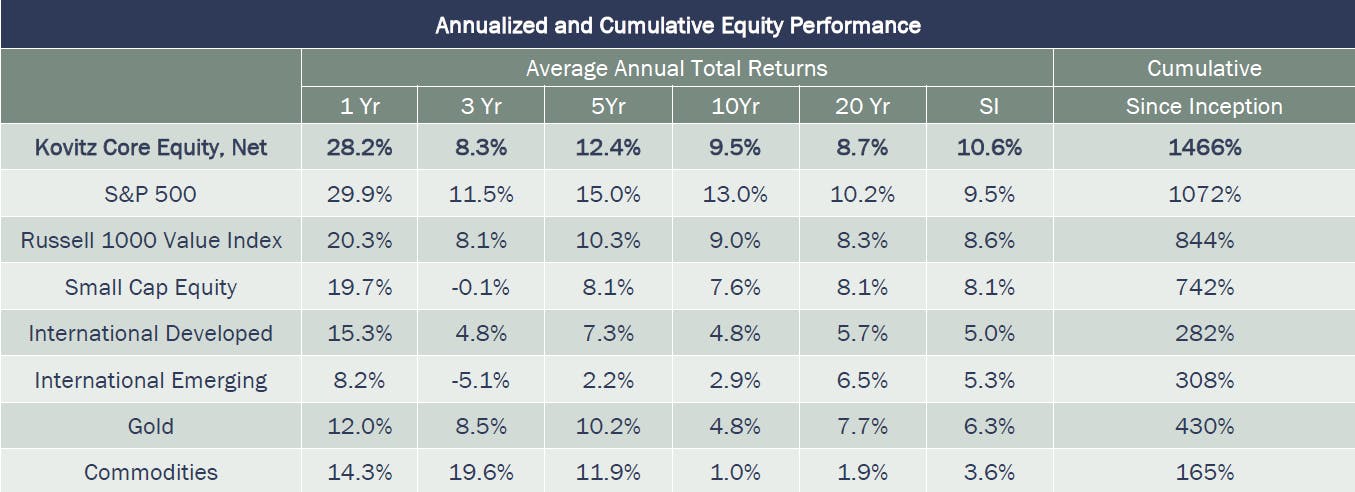
During the first quarter of 2024, the Kovitz Equity Composite[1] (the “Composite”) increased by 10.3%[1], net of fees. By way of comparison, the S&P 500 was up 10.6% while the Russell 1000 Value Index rose 9.0% for the same period.
Since inception on January 1, 1997, the Composite has returned a net 10.6% annualized, compared to 9.5% and 8.6% for the S&P 500 and Russell 1000 Value, respectively. With the benefit of compounding, the Composite’s annual return translates into a cumulative total return of 1466.3% versus 1072.4% for the S&P 500 over the same period. The respective cumulative return for the Russell 1000 Value Index has been 844.3%. As these numbers illustrate, the compounding nature of annual returns is a powerful force. As such, we always keep in mind Charlie Munger’s first rule of compounding, which is to “never interrupt it unnecessarily.” Attempting to time the market by jumping in and out at what seems opportune times, while alluring, will most likely end up in returns falling far short of what you would achieve with a little patience and resisting the urge to “interrupt” the compounding.
--------------------------------------
The stock market continued its advance that began in earnest in late October of 2023 and has seen the S&P 500 rise over 28%. Since 2024 began, the market has made a slew of new highs, eclipsing the prior record set in early 2022. This was right before the Federal Reserve began to aggressively raise interest rates to combat rapidly rising inflation, causing both stocks and bonds to plunge.
The catalyst for this recent advance appears to be a consensus that inflation has begun to be brought under control without triggering a recession. This view was validated by Federal Reserve Chair Jerome Powell, who has expressed confidence that the current fed-funds rate of 5.25% to 5.5% is likely the peak for this cycle. While Powell added the caveat that the Fed will be patient until there is more evidence that inflation is moving sustainably back to its 2% target, this suggests the Fed believes it could be appropriate to begin to dial back its restrictive policy stance at some point during this year. An influx of positive economic data and an Artificial Intelligence-driven rally in technology stocks have also lent support to the equity market.
What’s noteworthy, in our opinion, is that this stock market rally has persisted despite the fact that most of its original justification has largely fallen away. Much of the market’s gain since late October was premised on the idea that the Federal Reserve would react to slowing inflation with several rate cuts in 2024, potentially starting as early as March. However, recent comments from members of the Fed, along with signs of a resilient economy, low unemployment, and inflation proving more stubborn in continuing its trend lower, suggest that the first interest rate cut may not come until mid-year or even later and that the magnitude will be less than what had been anticipated several months ago. So why has the upward market momentum continued despite the timing and number of cuts being dialed back? Our best guess is that perhaps investors are willing to tolerate slightly higher inflation data as long as that is being accompanied by solid economic growth, which should provide a boost for company earnings growth. In other words, rate cuts are now less important than company fundamentals.
If that is indeed the case, this is a welcome reprieve from the market’s fanatical focus on the Federal Reserve and its interest rate policy that had existed prior. The amount of brainpower that was being used to decipher the Fed’s next move regarding interest rates was staggering. On a daily basis, the outlook for stocks and bonds vacillated solely on macro-economic news, the parsing of Federal Reserve Governors’ speeches, and the impact these had on the prospect for interest rates levels and the Federal Reserve’s unicorn-like soft landing scenario. Company fundamentals were barely discussed.
As we know full well, interest rates are a primary input into stock valuations, so the debate on its future levels is important. However, to make that the sole source of investment focus seems a bit off the mark. Over an investment lifetime, interest rates will range from low to high and everything in between. When selecting businesses we want to own, we instead focus on what we can control, which is identifying great businesses that possess a combination of strong and durable competitive advantages, robust financial profiles, and stock prices that incorporate a margin of safety. In our opinion, public equity investing is not about owning something that should be bought or sold based on near-term prospects for interest rates or other economic indicators. Rather, it is about owning small pieces of wonderful businesses, where we “partner” with management teams that are focused on growing the intrinsic value of the business over a multi-year timeframe.
There’s no doubt that markets have seen an astonishing rally. During the first three months of the year, the stock market did not suffer a single pullback of 3% or more. Market declines of 5%, or even 10%, are commonplace in a volatile asset class such as equities. Amidst this backdrop, it’s natural to wonder if valuations of stocks are getting ahead of the fundamentals. It’s possible. Yet, acknowledging that risk is much different than acting on it, which is akin to market timing; something we mentioned earlier that we are loathe to do in any circumstance. Instead, we can continually monitor the stocks in our portfolio versus our estimate of business value, and trim back, or sell, those that are close to or above this value and reallocate the proceeds to those positions that are trading at much wider discounts. We consider this “pricing the market” as opposed to timing it. Actions described in the “Portfolio Activity” section below speak to this point.
Were we to get a substantial pullback, keep in mind that downside volatility is not necessarily a bad thing. In fact, it can be just the opposite. It presents opportunities for a well-disciplined and well-prepared investment team such as ours to add exposure to temporarily depressed high-quality companies.
Regardless, this is a time to disregard the fear of missing out and to be highly diligent and manage risks appropriately. This is accomplished by sticking to our clients’ well-thought-out target asset allocations and rebalancing when appropriate.
PERFORMANCE SUMMARY
The table below summarizes annualized and cumulative performance for the Composite[2] as well as results for the S&P 500 and other benchmarks over standardized time periods beginning on January 1, 1997, and ending March 31, 2024.
Annualized and Cumulative Equity Performance
Source: Bloomberg Finance, L.P.
PORTFOLIO ACTIVITY
During the quarter we initiated one position and exited 3 positions. We also added to 4 positions while reducing 5. The general theme of these portfolio changes is similar to what we have done in the past: allocating capital away from companies that have seen their shares prices move close to or above our fair value estimates and towards businesses selling at larger discounts to our base case valuations while maintaining our focus on quality.
Initiated: Oracle
Oracle
We initiated a new position in Oracle Corp. (ORCL). Oracle is one of the largest, most enduring software businesses in the world with leadership positions in database and enterprise software, and an emerging strong position in cloud infrastructure-as-a-service (IaaS). Over 400,000 businesses run on Oracle software. Their products are considered mission critical, and their customers would struggle to function if Oracle’s key products ceased to exist. Switching costs are also very high.
Oracle suffered from a lack of revenue growth for most of the 2010’s as some of its legacy software matured, but persistence and recent product and strategic advances have changed the picture for the better. For example, after several failed attempts, they have succeeded at joining Amazon’s AWS, Microsoft’s Azure, Google’s GCP as a major cloud provider. Their IaaS offering is similar but has a cost advantage related to generative AI. Additionally, Oracle has successfully improved its software applications offerings, is a major Business-to-Business Software-as-a-Service (SaaS) provider, and scores well in key categories vs. competitors as judged by 3rd parties such as Gartner. As a result, Oracle’s growth has improved over the last several years and appears sustainable. We like that Oracle can convert their long list of legacy license software clients to their cloud offerings with a greater than 2x increase in revenue per customer over time.
The opportunity to purchase the shares at what we felt was a depressed valuation came about as Oracle missed quarterly expectations for its fiscal second quarter (ending November 2023) and the stock declined sharply. Importantly, Oracle missed not because of a lack of demand, but because they couldn’t bring on supply fast enough to meet demand in their cloud infrastructure business. At the time of our initiation, we believed this was a short-term issue and that the starting multiple was fair-to-slightly depressed for a business of this quality.
Fast forward just one quarter to its recently reported fiscal third quarter earnings (ending February 2024), and the stock surged on better-than-expected earnings that showed AI is boosting the company’s cloud business. Further the company’s remaining performance obligation (RPO - a measure of backlogged work) increased 29% to more than $80 billion, which was much higher than investors had been anticipating. While results may continue to be lumpy, we were happy to see the market reward Oracle for its strong demand and remain confident that the company will likely compound earnings nicely from here.
Increased: AON, Becton Dickinson, CarMax, and PPG
AON
As an insurance broker, Aon (AON) benefits from the ever-increasing financialization and complexity in the world and near-term conditions of a “hard” market (industry jargon for strong pricing) in the insurance industry. The shares sold off around 10% recently after Aon announced an acquisition of NFP, the tenth largest insurance broker globally, at what was considered an expensive valuation. While we don’t disagree with the latter point, our view is that the acquisition is value-neutral and immediately gives Aon a strong foothold in the middle market where growth has been outstripping that of the largest businesses where Aon has typically focused.
We acknowledge that Aon is facing some short-term challenges. In addition to the digestion period that will follow the NFP acquisition, additional headwinds include cash expenses for a restructuring program and the maturation of the hard insurance market. However, demand for risk solutions is high given the increased frequency of weather-related catastrophes, supply chain risks, and the ever-increasing costs of employer-sponsored health insurance. Aon is a leader in the industry for its risk management tools that are allowing for more available options to manage proliferating risks. Additionally, Aon is a leader in insurance for M&A transactions, which has been in decline since a boom in 2021. Any improvement in this dynamic could boost Aon’s growth rate ahead of competitors. With both the broader market and many of our holdings trading higher over the past year, this recent sell-off provided the opportunity to increase our exposure to a great business with an improved mix of risk and reward relative to alternatives.
Becton Dickinson
During the quarter, Becton Dickinson (BDX) reported earnings that we considered positive, with building sales momentum in key product categories, good balance sheet strength, and nice progress in both newly launched products and with its new product development pipeline. While headline revenue growth result looked somewhat mediocre, with organic growth up just 2.5%, this was due to a variety of temporary factors including tough year-over-year comparisons for some products that had strong COVID-era demand in early 2023, an absence of sales from product divestitures undertaken to improve profitability, and a strategic decision to run the manufacturing operations at a low factory-utilization rate in order to reduce inventories. The company also had some adverse foreign exchange dynamics in the quarter. In our opinion, these headwinds are set to fade away, and growth and profitability should accelerate over the next couple of quarters. Hospital demand for procedures is good, providing a solid background for the business. With the stock mired near its low over the past year, we think this presents a good opportunity for a forward-looking investor.
CarMax
CarMax (KMX) has been navigating a soft environment for used vehicle sales since early 2022, which has primarily been driven by poor affordability after used vehicle prices rose much faster than broader inflation. In August of last year, we reduced our position in the company. Since that time, KMX has traded down about 20%, while the broader market had risen 10% (at the time of our purchase). There have also been a number of positive developments, which has caused us to reverse course and add to our position.
While this has been a challenging time for the company, we have been heartened by the management’s efforts to control costs while continuing to enhance their advantages in customer acquisition, vehicle sourcing, and logistics. We have also watched once-feared online-only peers Shift Technologies and Vroom fall into bankruptcy, while Carvana avoided a similar fate only by restructuring their debt to temporarily defer cash interest for two years. Additionally, used vehicle prices have now fallen 22% since their early-2022 peak and the relative spread between new and used vehicle pricing is starting to approach historically normal levels. This has markedly improved affordability despite the increase in interest rates (i.e. price is much more impactful on payment than interest rate on a 5-6 year auto loan).
Since a vehicle is a wasting asset and turnover has been depressed for a couple years now, we believe it is only a matter of time before activity in the overall used vehicle market normalizes. It could be a year or two, or three, but CarMax is primed to capture at least their fair share of the market when that occurs. Despite the uncertainty regarding timing, we believe current prices reflect a myopic focus on current results and offer an opportunity to increase our position in a competitively advantaged business at an attractive discount to our estimate of intrinsic value.
PPG Industries
We also increased PPG (PPG) on the premise the stock’s valuation is too low in relation to its fundamental earnings power. PPG, along with Sherwin Williams, is one of the top 2 coatings companies in the world and operates in an industry with an advantaged oligopolistic structure where the top players are consolidating the smaller ones over time. PPG’s shares tend to trade at a discount to Sherwin Williams because investors believe its auto OEM (original equipment manufacturer) exposure is an inferior business to Sherwin’s leading share in the U.S. housing market. We agree that Sherwin’s exposure is better when just considering these two markets, but both companies are much more diverse (i.e. PPG has 80% of its sales in markets other than OEM automotive). PPG also has several end markets swinging in its favor, including aerospace, its large COMEX-Mexico paint business, Protective & Marine, Packaging coatings, and the OEM auto business, which is still seeing a volume recovery. Additionally related to auto OEM customers, PPG has gained 20% content per electric vehicle (EV) produced, with strong share in EVs being exported from China. It also has ample housing exposure and a growing partnership with Home Depot. This market should recover when existing home sales pick up. Moreover, PPG is enjoying margin expansion from raw material and supply chain cost relief, which should continue in 2024. PPG stock is trading for 16x earnings, which is 60% of Sherwin’s valuation and about 75% of the S&P500’s multiple. Given an expectation of double-digit profit growth in an otherwise challenging 2024 landscape, we believe the shares should close this valuation gap over time.
Exited: Charter Communications, Gildan, and Splunk
Charter Communications
Originally purchased in phases throughout early 2020, we were attracted to Charter’s (CHTR) position as a low-cost provider of high-speed internet access within their network footprint, a strong competitive position where Charter was often the only option for high-speed internet, early success bundling mobile phone service with broadband at highly attractive rates for customers, and an aggressive share repurchase program. Charter proceeded to be a major beneficiary of COVID-era trends of increased working from and time spent at home and the associated need and/or willingness of customers to sign up for or upgrade their internet service.
However, the increased demand combined with low interest rates and the advancement of wireless technology brought on a significant increase in competition in the form of fiber “overbuilders” and fixed wireless access. Rising interest rates also reduced existing home turnover, which limited Charter’s opportunities to win new customers as they moved. These headwinds combined with a COVID hangover resulted in broadband subscriber growth decelerating markedly, although remaining positive.
Our view was that Charter’s ability to provide an equal or superior broadband service at the lowest cost – and to increasingly bundle that offering with mobile service that would further entrench those customers with Charter – would sustain subscriber growth and allow the company to continue returning substantial amounts of capital to shareholders. We also viewed the threat from fixed wireless as temporary given the seemingly limited excess network capacity at the legacy mobile carriers.
However, Charter reported that they had started losing broadband customers in the fourth quarter of last year and were increasing capital expenditures to expand their footprint and restart growth, which we interpreted as a highly defensive move. Ultimately, we underestimated the intensity of the competition the legacy telecommunication companies (telcos) would bring as expanding into broadband was their only avenue towards growth. We further underestimated how rapidly the telcos’ fixed wireless offerings would grow to millions of subscribers despite being inferior products but that customers have decided that the cheaper alternative was “good enough” for their needs. Given the combination of Charter’s financial leverage, increasing and increasingly defensive capital expenditures that are crimping free cash flow, and uncertainty as to when or if the company can return to sustainably growing broadband subscribers, we decided to exit the position.
Gildan
We lowered our exposure to Gildan (GIL) in the fourth quarter of last year. At the time, we wrote the following:
“Gildan (GIL) announced that the founder, CEO, and 40-year veteran of the company, Glenn Chamandy, had left the company. Later that same morning, Mr. Chamandy later issued a statement indicating he had been fired without cause. The shares subsequently fell ~10% on this surprising news.
Mr. Chamandy’s termination points to a major disagreement over the direction of the company between him and the board. Making the timing more curious, this announcement comes on the heels of a quarterly report that showed the company was making progress lapping inventory destocking issues among the company’s retailer and distribution partners that had been pressuring results in 2023.
Given the uncertainty introduced by this sudden departure of an owner-operator CEO who was the driving force for the company’s strategic vision, we chose to reduce our position. After our sale, a number of large shareholders have initiated a campaign to reinstate Mr. Chamandy and oust the Board. We continue to assess additional information as we obtain it and weigh our options regarding the remaining position.”
In the subsequent weeks, tensions continued to mount. Shareholders owning roughly a third of the shares outstanding have publicly called for Chamandy to be reinstated, while the board has held its ground. Kovitz has remained officially silent on the matter. The situation has now deteriorated to the point where either the board, Chamandy, or shareholders are issuing dueling press releases on almost a daily basis accusing others of acting inappropriately.
While we previously believed the shares to be undervalued, recent events have painted a picture of a company in disarray and statements by the board and Chamandy have given rise to doubts regarding the company’s long-term growth prospects. These doubts are unlikely to be resolved in the near-term as the board and shareholders wrestle over who will end up running the business between Chamandy or the board-appointed replacement.
Despite our appreciation for Gildan’s low-cost operating model and market dominance in certain areas of the printwear industry, we have decided to take our capital off the table, await the outcome of the wrangling over succession, and assess the merits of whatever strategic plan is put forth by whoever ends up leading the company at that time.
Splunk
Roughly five months ago, Cisco announced they would be acquiring Splunk (SPLK) for $157/sh. With the acquisition deemed highly likely to close, we have been viewing our position in Splunk as the equivalent of high-yielding cash for a number of months. With the shares recently trading above $155, thus offering minimal incremental “yield” to the deal price, we chose to take the cash today rather than risk any push-out in the expected time to close the deal.
Trimmed: Alphabet, JPMorgan, Meta Platforms, PACCAR and Spotify
Alphabet
Just as we did last quarter, we continued to reduce our position in Alphabet (GOOG/GOOGL) based on its overweight weighting in the portfolio. The company had a good year in 2023 from a business sense, with its revenue up roughly 9% and its operating income up 13%. Furthermore, Alphabet successfully advanced its generative AI products, both consumer-facing and for enterprises, although it’s early days in this new competitive landscape. The company has also been through a beneficial spending inflection. After an accelerated hiring binge from 2019-2022, where headcount grew from 119 thousand to 190 thousand, headcount began to shrink in 2023 and profit margins improved. The long-unprofitable Google Cloud division also posted its first annual profit in 2023. The stock’s 58% price return in 2023 reflects these positive developments. That move brought the stock price closer to our value estimate, and we found it prudent to rebalance by trimming some of the position size. We continue to like Alphabet as an investment and see continued revenue growth and value accretion ahead. As such, the stock remains a substantial weight in the portfolio.
JPMorgan
JPMorgan (JPM) reached an all-time high recently as the market consensus reflected belief the Fed would achieve a “soft landing” (or maybe no landing) and perhaps begin cutting interest rates in 2024. The former has led to more benign expectations for credit losses, while the latter would be expected to reduce pressure on the bank’s funding costs and return the yield curve to an upward slope, which would be positive for JPMorgan’s net interest margin. JPMorgan remains the premier operator in the banking industry with leading positions in consumer credit, commercial lending, investment banking, and wealth management. It also earns consistent high-teens returns on its equity capital, and a fortress balance sheet that has allowed them to be the buyer of first resort when competitors get overextended, such as picking up the remains of First Republic last year for a pittance. However, with market expectations quickly incorporating a more forgiving outlook for 2024, we chose to manage the position size down modestly.
Meta Platforms
We reduced our position in Meta Platforms (META) to manage our exposure after a sharp increase in price since reporting strong Q4 earnings that surpassed consensus expectations on all fronts. At the time, the $205 billion of market value added after the report was the largest single day gain in dollars for any company ever (this record didn’t last long as it was eclipsed a few weeks later by Nvidia after their own blow-out Q4 report.) The results are clear evidence that the company’s multi-year efforts to incorporate AI into content suggestions for users and targeting ads have resulted in an acceleration in user growth (off a hard-to-fathom 3 billion user base), increased engagement by current users, and more effective ads. The company also guided that they expect that growth trend to continue into this year while maintaining their prior guidance on costs. This will likely generate positive operating leverage and a step up in margins. We continue to evaluate the impact of these increased expectations on our assessment of intrinsic value.
PACCAR
We trimmed PACCAR (PCAR) as significant outperformance versus the S&P500 had caused the position to be somewhat oversized, and that the company’s business prospects are more fairly appreciated now versus when we initially built the position in mid-2022. This experience demonstrates that one need not own just the big headline mega-cap stocks to achieve outperformance.
Our going-in premise for PACCAR was that its profit potential was underappreciated given that the 2021 new model introductions would command higher profits, while the superbly run PACCAR Parts business would be a recurring, highly profitable revenue stream that followed the growth of the installed base over the prior decade. Moreover, many trucking fleet owners were behind in upgrading their fleets given the COVID-era supply chain disruptions, so demand was strong. The industry had also recently been through a consolidation, and we posited it was likely that competitors would exercise stronger pricing discipline than in the past. All these things have come to pass. While many of them will continue to be beneficial, we feel that others now see the merits we had anticipated, and so we’re acting to rebalance the position to a smaller weight.
Spotify
We made a more substantial cut in our position in Spotify (SPOT), selling roughly half of what was generally a smaller position to begin with given that the business was early in its lifecycle with a wider range of outcomes.
We initiated our position in Spotify in early 2022 at an average of around $167 after the shares had declined roughly 50% from their 2021 peak. While the business was unprofitable at the time, we believed Spotify was a unique network-effect business with a great product that could rapidly scale its user base in a way that would generate exceptional profits in a short period of time.
While revenues grew substantially in 2022, so did costs, and the shares subsequently declined further along with the broader sell-off in tech-related stocks, bottoming around $72 in late 2022. However, pressure from shareholders mounted, and management embarked on a concerted effort to rein in ballooning costs.
2023 brought with its user growth and cost cuts that both exceeded expectations, including double-digit user growth in already highly penetrated U.S. and European markets. With the shares appreciating 265% since their 2022 low, we believe that the market is appraising the company much closer to our estimate of fair value. Because there is still much to do to achieve sustained profitability in the business, we believe a reduction in position size is warranted and improves the risk-return of the portfolio. Our positive long-term view of the business is unchanged.
--------------------------------------
[1] The returns for the equity portion of your individual account will differ somewhat from the Composite due to variations in account holdings, cash position, and other client-specific circumstances.
[2] The returns for the equity portion of your individual account will differ somewhat from the Composite due to variations in account holdings, cash position, and other client-specific circumstances. Please refer to the last page for a complete GIPS compliant presentation, along with important disclosures
DISCLOSURES
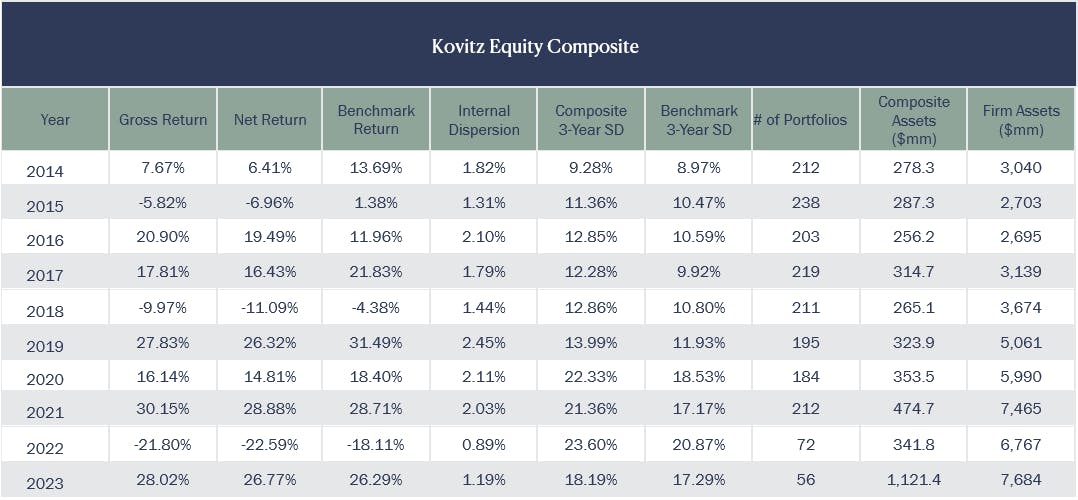
Fees: Gross-of-fees returns incorporate the effects of all realized and unrealized gains and losses and the receipt, though not necessarily the direct reinvestment, of all dividends and income. Gross-of-fees returns are presented before management fees, but after all trading expenses. Prior to October 1, 2020, Composite net-of-fees returns were calculated by deducting model investment management fees, which are defined as the highest, generally applicable fees of 1.25% of equity assets and 0.50% of cash assets, from the gross composite return. Beginning on October 1, 2020, the Composite net-of-fees returns are calculated by deducting model investment management fees, which are defined as the highest, generally applicable fees for the strategy of 1.00% of all composite assets. The firm’s current management fee schedule is as follows: 1.25% on assets below $1 million, 1.0% per annum for assets from $1 million to $5 million, 0.85% per annum on assets from $5 million to $10 million, 0.75% per annum for assets from $10 million to $20 million, 0.65% per annum for assets from $20 million to $35 million, 0.55% per annum for assets from $35 million to $50 million, and 0.50% per annum for assets over $50 million. Such fees are negotiable. Where applicable, the total bundled or wrap fee charged to each portfolio is dependent on the end client’s financial advisor and wrap sponsor. The composite includes accounts that do not pay trading fees.
Prior to January 1, 2010, the Composite included the performance of assets that had been “carved out” of multiple asset class portfolios. When calculating performance, a hypothetical cash balance for each month was allocated to the carve-out on a pro-rata basis relative to the portion of each portfolio’s assets that comprised the carved-out asset class. Beginning January 1, 2010, changes in the GIPS standards caused the Composite to be redefined and all carve-outs to be removed from the Composite. Carve-outs formerly included in the Composite continue to be managed in the same manner as they were before being removed from the Composite.
Definition of The Firm: Kovitz Investment Group Partners, LLC (Kovitz) is an investment adviser registered with the Securities and Exchange Commission under the Investment Advisers Act of 1940 that provides investment management services to individual and institutional clients. From October 1, 2003, to December 31, 2015, the Firm was defined as Kovitz Investment Group, LLC. Effective January 1, 2016, Kovitz Investment Group, LLC underwent an organizational change and all persons responsible for portfolio management became employees of Kovitz. From January 1, 1997, to September 30, 2003, all persons responsible for portfolio management comprised the Kovitz Group, an independent division of Rothschild Investment Corp (Rothschild).
Composite Definition: The Kovitz Equity Composite includes all fee-paying, discretionary portfolios managed to the Kovitz Core Equity strategy. The Kovitz Core Equity strategy utilizes a private owner mentality to purchase equity securities issued by companies with durable competitive advantages and strong balance sheets that are trading at a significant discount to their intrinsic value. The goal of this strategy is to maximize long-term total return. The Composite’s inception date is January 1, 1997. The Composite was created on January 1, 2001. Effective January 1, 2000, the Composite no longer included portfolios managed by a manager who made a change in investment style. The persons currently responsible for managing Composite portfolios have been primarily responsible for portfolio management throughout the entire period shown. The minimum portfolio size to be included in the Composite is $250,000 until December 31, 2021. Thereafter, the strategy minimum was raised to $1 million. Portfolios in the Composite may occasionally make use of leverage and/or derivatives, but such use does not have a material effect on Composite performance. The use of derivatives is generally limited to covered call writing, and uncovered option writing is never used.
The benchmark for the Composite is the S&P 500 Index. The S&P 500 Index is composed of 500 leading companies in the United States, covers approximately 75% of the market capitalization of U.S. equities, and serves as a proxy for the total market. The S&P 500 Index returns do not include the effect of transaction costs or fees and assume reinvestment of dividends into the index.
GIPS: Kovitz Investment Group Partners, LLC (Kovitz) claims compliance with the Global Investment Performance Standards (GIPS®) and has prepared and presented this report in compliance with the GIPS standards. Kovitz has been independently verified for the periods January 1, 1997 through December 31, 2022. The verification report is available upon request. A firm that claims compliance with the GIPS standards must establish policies and procedures for complying with all the applicable requirements of the GIPS standards. Verification provides assurance on whether the firm’s policies and procedures related to composite and pooled fund maintenance, as well as the calculation, presentation, and distribution of performance, have been designed in compliance with the GIPS standards and have been implemented on a firm-wide basis. Verification does not provide assurance on the accuracy of any specific performance report. GIPS® is a registered trademark of CFA Institute. CFA Institute does not endorse or promote this organization, nor does it warrant the accuracy or quality of the content contained herein.
Valuations are computed and performance is reported in U.S. dollars. The measure of internal dispersion presented above is an asset-weighted standard deviation. The three-year standard deviation presented above is calculated using monthly net-of-fees returns. The three-year standard deviation is not presented when returns of less than 36 months are available. The risk measures, unless otherwise noted, are calculated gross of fees. A complete listing of composite descriptions and policies for valuing portfolios, calculating performance, and preparing GIPS reports are available on request. The composite includes accounts that do not pay trading fees.
The description of products, services, and performance results of Kovitz contained herein is not an offering or a solicitation of any kind. Past performance is not an indication of future results. Securities investments are subject to risk and may lose value.