Market Insights 1Q24

PROGRESS IS SLOW, BUT MARKETS ARE FAST
For much of recorded history, humans had no idea how individual traits were passed from parent to child nor how the various functions of the body operated. It was acknowledged that the heart was in the chest, but there was no knowledge of how it got there or why it wasn’t sometimes in the leg. Each hand and foot had five digits, but why not three or ten? Or a hoof? There were diseases and cancers just as there are now, but these were thought to be afflictions caused by an imbalance of the “humors” or a curse from the gods as opposed to bacteria, viruses, or genetic mutations.
Even when the existence of what would later be called a “gene” was theorized by Gregor Mendel in 1866, it would be another sixty years before other scientists were able to prove its existence. Another 20-30 years would go by before DNA was identified as the repository for genetic information and its basic structure defined. Further advancements eventually led to the first sequencing of DNA in 1972. Over a century passed between “I think this exists” and a rudimentary understanding of molecular biology.
This is not how modern markets work. Competition, the ever-increasing speed and volume of information, and human emotions congeal into a toxic brew that is rapidly translated into the prices of securities. Markets have certainly become more efficient at processing information over time, but the primal instincts of fear and greed often cause markets to swing wildly from enthusiasm to depression and back again.
A case in point would be the reaction to the Federal Reserve (the “Fed”) pivoting to a more accommodative monetary policy stance last October. Almost immediately, the bond market began pricing in significant reductions in the Fed funds target rate and the year ended with the yield curve implying roughly 1.50% of cuts that would begin in March of this year, prompting the yield on the benchmark 10yr Treasury bond to fall from 4.9% to 3.9% in two months. There was no waiting for a few more months of inflation or employment data; the market had a view, that view changed, and trillions of dollars of bonds repriced to reflect that view in short order.
If the bond market had waited, it would have seen that inflation, while well below the peak in 2022, has proven stickier than hoped. Core PCE, the Fed’s preferred inflation measure, has plateaued just under 3% on a year-over-year basis, which is still above the Fed’s unofficial 2% long-term target. Combined with persistently low unemployment and stable GDP growth, the economy has been deemed too good to justify the rapid rate cuts that were expected to start this year. This new view combined with the Fed holding interest rates steady after the much-anticipated March meeting led bond yields to reverse roughly half of their decline in the prior quarter.
STOCK MARKET DON’T CARE
Curiously, this reversal of sentiment on interest rates did nothing to slow down the ongoing rally in the stock market[1]. The 14% gain on stocks registered in the last two months of 2023 was largely credited to the anticipated decrease in interest rates. Yet, despite generally rising yields during the first quarter, the rally charged on to gain another 10.5%. While the magnitude of gains was impressive in its own right, the consistency was even more notable. Of the 61 trading days in the first quarter, the market hit a new all-time high on 24 of them, and it did not suffer a drawdown of more than 2% over any length of time.
These last five months brought the market’s gain to just over 50% since the end of the 2022 bear market. While the early part of this rally was fueled primarily by mega-cap Tech (or Tech-associated) names, the strong gains over the last five months were much more broad-based. With a forward price-to-earnings ratio of 21x, the market, as a whole, is more expensive than any time in at least the last 30 years outside of the late-90s Tech Bubble and the highly disrupted post-COVID recovery period. In fact, this rally has capped off what has simply been an extraordinary decade-plus of returns for U.S. equities. While stocks have averaged a 9.5% compound annual return over the past century (or so), the roughly 12-year period beginning with the first all-time high following the 2008 Global Finance Crisis through the end of this past quarter saw stocks producing a compound annual return of 13.7%, or more than quadrupling in value. Furthermore, this occurred while the return on cash[2] was a mere 1.1%, which means the “excess” returns on stocks over a risk-free alternative were a truly astounding 12.5%[3]. What a time to be alive!
THE PAST DOESN’T REPEAT, BUT A DECENT RHYME WOULD BE FINE
These unusually high returns have left investors in a bit of a quandary about what to expect going forward. Various surveys have shown that the extraordinary returns of the recent past have led some investors to expect above-average returns going forward. Conversely, it’s easy to find others who believe the market is headed for a crash as valuations and average returns revert to their long-term means.
To be sure, reproducing the “excess” returns of the past 12 years would require a number of more or less herculean assumptions. The first hurdle is that returns available on cash are much higher today. The yield curve currently implies that cash will return 4.5% over the next decade. That may or may not turn out to be true, but it’s a good baseline estimate. This means stocks would have to return 17.0% to generate the same level of excess returns as the prior 12 years.
Furthermore, equity returns can be broken down into three components: earnings growth, the change in the valuation of those earnings, and the dividend yield. The current dividend yield is 1.4%, which leaves 15.6% annual returns that need to be generated from a combination of earnings growth and expanding P/E multiples. For context, average earnings growth for the S&P 500 over the past 50 years was 6.7%, the average P/E multiple was in the mid-to high-teens, and the peak earnings multiple during the late-90s Tech Bubble was 25.2x forward earnings. So, if earnings grew at the same 7.2% rate they did during the prior 12-year period, which was above the 6.7% 50-year average, the P/E of the overall stock market would have to expand from today’s already well above-average 21x all the way to 44x earnings by the end of the next decade. Suffice to say, that seems unlikely. Alternatively, valuation multiples could simply stay at today’s elevated levels and earnings could grow at 15.6% per year, or 2.5x faster than the 50-year average. That also seems quite unlikely.
Figure 1: Forward P/E Required in 10 Years to Match Excess Return of Stocks over Cash During Prior 12 Years
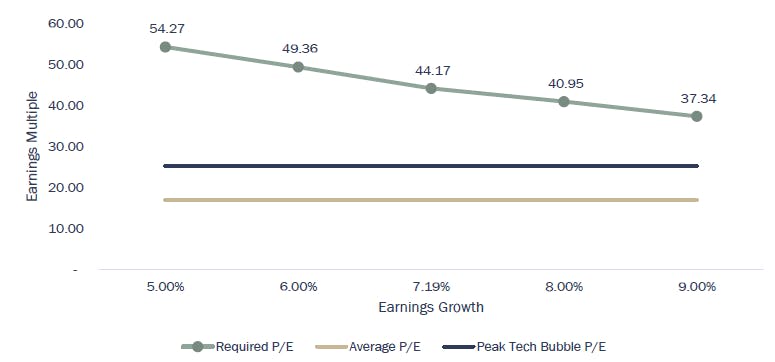
Source: Kovitz using data from Bloomberg Finance, L.P.
That may appear to be a bleak setup for the next decade, but take heart. All is not lost. The excess returns of the recent past are more than likely (okay, almost definitely) out of reach, but that does not mean that returns going forward will not be good enough. And good enough is all we need. After all, there is not a single financial plan or projection Kovitz has ever produced that requires equity returns to exceed cash by 12.5% in order to meet a client’s financial goals. A figure conservatively below the 9.5% long-term average for equity returns is actually the norm used in our projections. In the context of the long-term average earnings growth mentioned above, this remains a realistic assumption. Additionally, from this point forward, it is a good thing that both short-term and long-term bonds are producing a meaningful yield for the first time since 2007. This broadens our options when formulating an asset allocation framework.
In conclusion, the market may seem frothy after a period of above-average returns and the near future may not look like the recent past, but we have seen this show before. We have seen this show in workshop, on Broadway, the national tour, and its many, many revivals. Expectations grow, pressure builds, and, eventually, human nature manifested as the numbers on the screen gets ahead of itself and all that weight comes crashing down, only to have the process reverse. It is impossible to know when that froth will get blown off. It could be tomorrow. It could be three years from now. It could be never.
That is why we frame our counsel in terms of the decades-long time horizons of our clients, not the daily or minute-by-minute time horizons focused on by financial and social media. Markets will always move fast. That is what they are designed to do. But, like the eternal march of scientific advancement, progress towards our financial goals happens slowly and erratically, yet steadily and undeniably progress does occur if not interrupted unnecessarily.
[1] All references to “the stock market”, “the market”, “stocks”, or their returns are represented by the S&P 500 Total Return Index.
[2] “Cash” returns are represented by the Bloomberg 1-3 Month US Treasury Bill Index.
[3] Numbers do not sum due to rounding.
DISCLOSURES
Fees: Gross-of-fees returns shown incorporate the effects of all realized and unrealized gains and losses and the receipt, though not necessarily the direct investment of, all dividends and income. Net-of-fees returns shown are supplemental to the Core Equity Wrap Composite shown above. They are calculated by deducting the transaction cost of 0.10% and a portion of the total wrap fee designated as Kovitz’ management fee, which is 0.35% of assets per annum, from the gross return. The total wrap fee applicable to a particular client is dependent on the fees charged by the client’s financial advisor under the RBC wrap program. Composite Net-of-fees returns are calculated by deducting the highest, generally applicable wrap fee, which includes all charges for trading costs, investment management, administration, and custody, of 2.0% of assets per annum, less the portion previously designated for trading expenses, from the gross return. The total wrap fee applicable to a particular client is dependent on the fees charged by the client’s financial advisor and the applicable wrap sponsor. Such fees are negotiable and do not represent the experience of any Kovitz client. Gross-of-fees returns are presented before the deduction of management fees, but after the deduction of the portion of the wrap fee designated for trading expenses. Current wrap fees can theoretically range from 1.0% to 3.0% of assets per annum.
Prior to January 1, 2010, the Composite included the performance of assets that had been “carved out” of multiple asset class portfolios. When calculating performance, a hypothetical cash balance for each month was allocated to the carve-out on a pro-rata basis relative to the portion of each portfolio’s assets that comprised the carved out asset class. Beginning January 1, 2010, changes in the GIPS standards caused the Composite to be redefined and all carve-outs to be removed from the Composite. Carve-outs formerly included in the Composite continue to be managed in the same manner as they were before being removed from the Composite.
Definition of The Firm: Kovitz Investment Group Partners, LLC (Kovitz) is an investment adviser registered with the Securities and Exchange Commission under the Investment Advisers Act of 1940 that provides investment management services to individual and institutional clients. From October 1, 2003 to December 31, 2015, the Firm was defined as Kovitz Investment Group, LLC. Effective January 1, 2016, Kovitz Investment Group, LLC underwent an organizational change and all persons responsible for portfolio management became employees of Kovitz. From January 1, 1997 to September 30, 2003, all persons responsible for portfolio management comprised the Kovitz Group, an independent division of Rothschild Investment Corp (Rothschild).
Composite Definition: The Core Equity Wrap Composite includes all fee-paying, discretionary portfolios, including portfolios managed under a relationship with a wrap sponsor, managed to the Kovitz Core Equity strategy. The Kovitz Core Equity strategy utilizes a private owner mentality to purchase equity securities issued by companies with durable competitive advantages and strong balance sheets that are trading at a significant discount to their intrinsic value. The goal of this strategy is to maximize long-term total return. The inception date for this composite is January 1, 1997, and the Composite was created on June 1, 2014. The minimum portfolio size to be included in the Composite is $250,000 until December 31, 2021. Thereafter, the strategy minimum was raised to $1 million. The benchmark is the S&P 500 index.
The benchmark for the Composite is the S&P 500 Index. The S&P 500 Index is composed of 500 leading companies in the United States, covers approximately 75% of the market capitalization of U.S. equities, and serves as a proxy for the total market. The S&P 500 Index returns do not include the effect of transaction costs or fees and assume reinvestment of dividends into the index.
GIPS: Kovitz Investment Group Partners, LLC (Kovitz) claims compliance with the Global Investment Performance Standards (GIPS®) and has prepared and presented this report in compliance with the GIPS standards. Kovitz has been independently verified for the periods January 1, 1997 through December 31, 2022. The verification report is available upon request. A firm that claims compliance with the GIPS standards must establish policies and procedures for complying with all the applicable requirements of the GIPS standards. Verification provides assurance on whether the firm’s policies and procedures related to composite and pooled fund maintenance, as well as the calculation, presentation, and distribution of performance, have been designed in compliance with the GIPS standards and have been implemented on a firm-wide basis. Verification does not provide assurance on the accuracy of any specific performance report. GIPS® is a registered trademark of CFA Institute. CFA Institute does not endorse or promote this organization, nor does it warrant the accuracy or quality of the content contained herein.
Valuations are computed and performance is reported in U.S. dollars. The measure of internal dispersion presented above is an asset-weighted standard deviation. The three year standard deviation presented above is calculated using monthly net-of-fees returns. The three year standard deviation is not presented when less than 36 months of returns are available. The risk measures, unless otherwise noted, are calculated gross of fees. A complete listing of composite descriptions and policies for valuing portfolios, calculating performance, and preparing GIPS reports are available on request. The composite includes accounts that do not pay trading fees.
The description of products, services, and performance results of Kovitz contained herein is not an offering or a solicitation of any kind. Past performance is not an indication of future results. Securities investments are subject to risk and may lose value.