Market Insights 4Q23

THE TROUBLE WITH FORECASTS
2023 will be remembered as the year that pundits, forecasters, the media, strategists, and plain, old, ordinary people tried to conjure a recession into existence through sheer force of will. The year opened with inflation slowing from its mid-2022 peak, but headline CPI was still above 6%, and the Federal Reserve’s (the “Fed”) preferred “Core” PCE[1] measure holding around 5%. The Fed had already raised the overnight federal funds target rate by 4.25%, and there was another 1.25% of hikes still to come. A significant majority of economists across a variety of surveys were predicting a recession in the first half of 2023 that might get delayed to later in the year if we were lucky. Following 2022’s 18% decline in the stock market[2], the consensus view of Wall Street strategists was for a modest increase of maybe 5% in 2023, with many predictions of further declines[3]. It is difficult to overstate how much negative stories and sentiment outweighed more optimistic views across video, print, and digital media.
Whoops!
If you have ever seen that old episode of the UK version of Family Feud where the guy answers “turkey” to every single question in the final round, that’s the equivalent of what happened to the doomsayers in 2023.
THE 2023 ECONOMY WAS ACTUALLY... GOOD?
While there were pockets of the economy facing headwinds in 2023, such as where rising interest rates reduced housing turnover and associated home improvement spending or inventory normalization dented demand from retailers and distributors for goods of all types, the broader economy remained decidedly healthy. Real GDP grew about 3%. Unemployment, which was hovering around all-time lows to start the year, barely budged through 2023, with the latest reading from November at 3.7%.
Then, there’s inflation. For much of the year, the debate around inflation was framed as a binary choice: The US economy could either have growth and low unemployment coupled with high inflation, or there would need to be a recession to bring inflation down. There was no middle ground to be had, yet a middle ground is exactly where the economy ended up. After peaking in 2022 at 9.1% and 5.6%, the year-over-year CPI and Core PCE measures of inflation ended 2023 at 3.1% and 3.2%, respectively. The 6-month annualized Core PCE, which gives a glimpse into more recent trends than the typically reported year-over-year figure, has come down to 1.9%, which is below the Fed’s stated 2% target. Plus, rents have been falling across most of the country, but the nature of calculating the housing (or “shelter”) component of inflation reflects this on a significant lag. So, there will be further downward pressure on inflation measures as we head into 2024.
All of this “unexpected” good news culminated in the stock market returning 26% for the year. Most of this return came in the final two months of the year when cooling inflation amidst a broadly solid economy caused the market to pivot sharply towards a belief the Fed would be ending its tightening cycle. This was seemingly confirmed after the December meeting of the Federal Open Market Committee, which officially sets interest rate policy, chose to leave the overnight fed funds rate unchanged for a third meeting in a row and surprised the market with a median expectation for the Fed to reduce rates by 0.75% in 2024. From a peak in October around 5%, the yield on the 10-year Treasury fell to 3.9% by the end of the year.
The market’s 14% return in November and December was also broadly distributed, unlike earlier in the year. Through October, the 10% return of the overall market was driven almost exclusively by the so-called “Magnificent 7” mega-cap stocks of Microsoft, Apple, Alphabet (Google), Amazon, NVIDIA, Meta Platforms (Facebook), and Tesla. (Personally, we would have gone with the acronym FATMAAN, but we digress.) Propelled by a combination of perceived economic benefits of nascent applications of generative AI and/or coming off sharp share price declines in 2022, these seven stocks, which now account for over 27% of the weight of the S&P 500, returned 78% through October while the remaining 493 constituents were roughly flat, in aggregate. Even after the broader rally to close out the year, the Magnificent 7 contributed roughly 60% of the return of the entire index.
FEELINGS VS. DATA
Interestingly, even with solid GDP growth, low unemployment, slowing inflation, a 26% return for US stocks, international stocks up 18%[4], bonds returning 5.5%, household net worth 30% above 2019 levels, and the Fed seemingly on the verge of engineering a “soft landing” and entering a more accommodative stance on interest rates, there remains a massive disconnect between “the data” and how people feel about the economy. The main culprit seems to be that cumulative inflation since 2019 has taken a psychological toll on the population. Even though increases in wages over that same timespan (Figure 1) have, on average, kept up with or even surpassed various rates of inflation, surveys indicate many people can’t shake the feeling that the economy is in poor shape.
Figure 1: FRED Data Comparing Earnings, Expenditures, and CPI
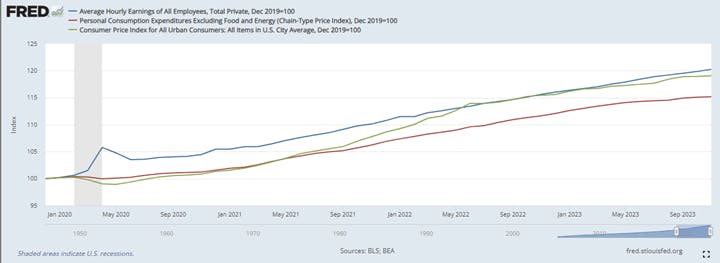
Source: Federal Reserve Economic Data | FRED | St. Louis Fed
Even more interesting, there remains a substantial difference between how people describe their personal financial situation versus how they describe the overall economy. In an October survey conducted by AP/NORC, 54% of respondents described their own household’s financial situation as good to very good. Meanwhile, when asked about the state of the overall economy, 73% of respondents – the same people, mind you – described the economy as poor to very poor.
Figure 2: Perceptions of the Economy vs Household Finances
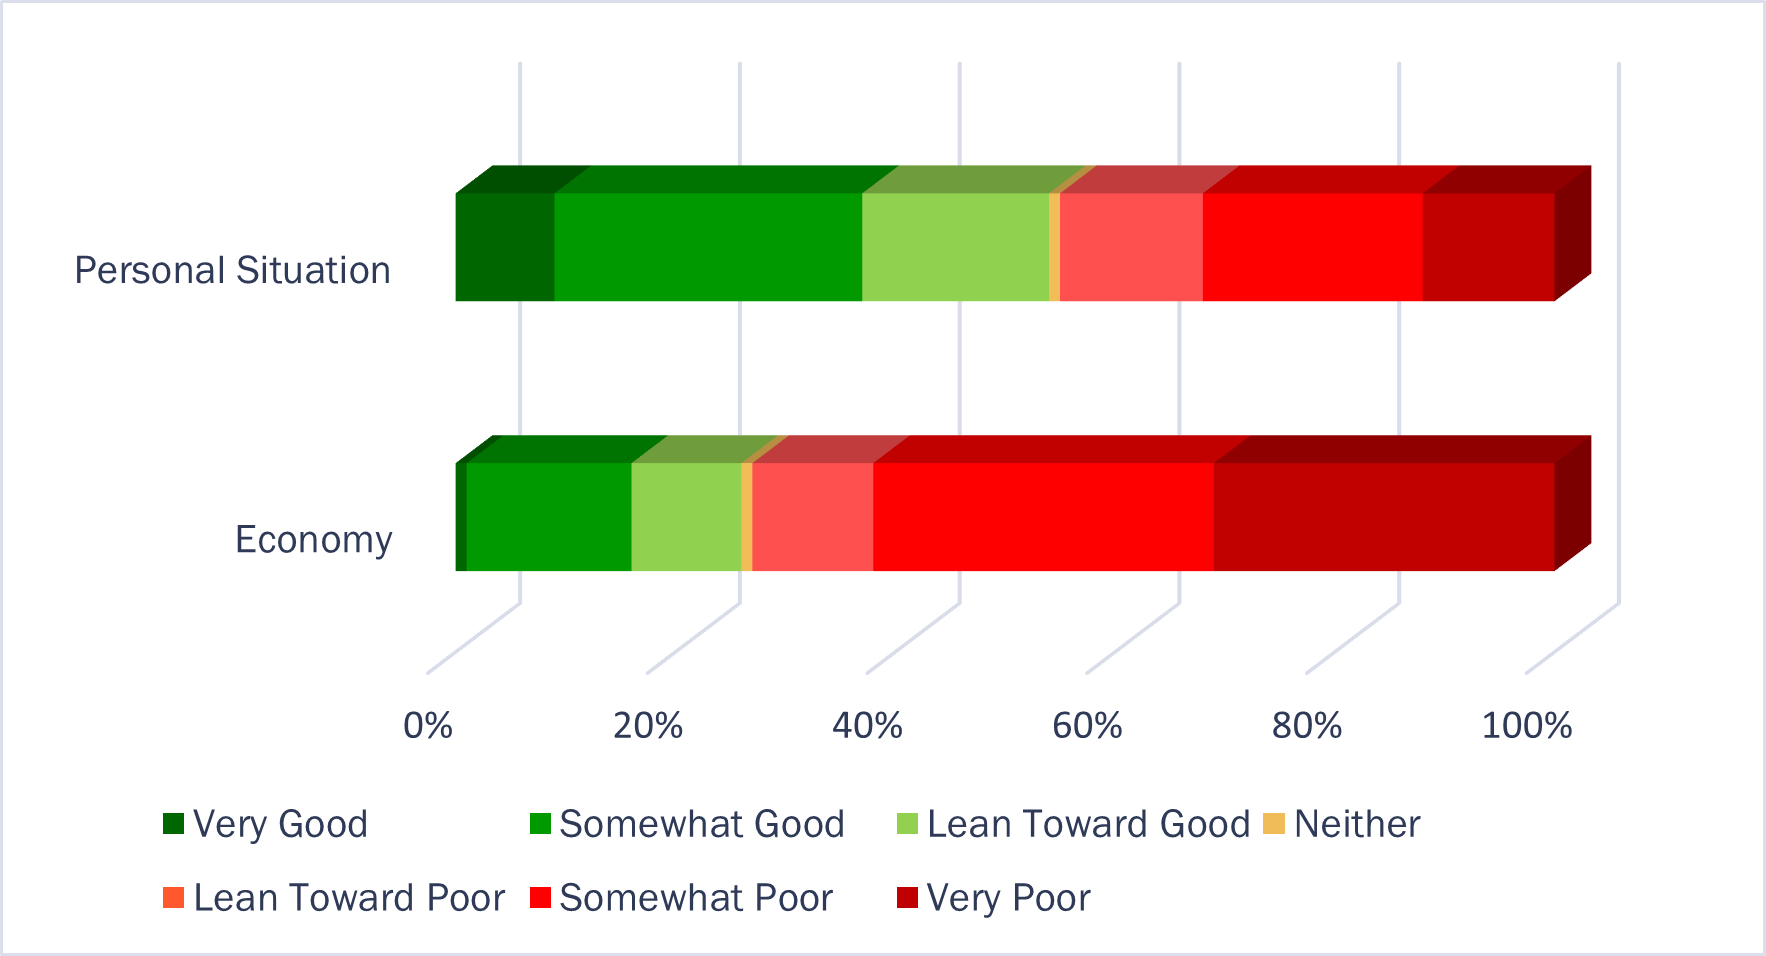
Source: Kovitz using data from October 2023 survey conducted by AP/NORC
It is tough to square these results, but this “data vs. feelings” disconnect will likely be an important determinant of economic growth in 2024. After all, feelings, not data, ultimately drive consumer behavior. And if enough people pull back on spending – and they actually pull back on spending, not just say they will – because they think things are worse than all of the data would suggest, that could turn into a meaningful drag on the economy.
OUR PREDICTIONS FOR 2024
As we enter a new year and the annual tradition of Wall Street firms rolling out their predictions for the economy and stock market targets gets underway, here are our predictions for 2024. The year will be 366 days long (leap year 😉). Some things will happen. Some will be good, others bad. There may yet be a recession. There may not be a recession. That’s about it.
Such forecasts may appear less impressive than the glossy 100-page reports filled with specific proclamations about the direction of the economy and markets typically put out by the big Wall Street firms, but that is the point. Our goal – our raison d’etre – is to help our clients protect and grow their accumulated wealth through sound financial planning, prudent investment selection, and, most importantly, keeping those pesky human emotions of fear and greed from derailing the best-laid plans.
It sounds simple on paper. To paraphrase the recently passed Charlie Munger, all one must do is stay on course through good times and bad, let the magic of compounding and time do their work to grow your wealth, and not unnecessarily interrupt that process. Yet, following that advice is anything but simple in practice. In fact, it can be quite hard.
In a year like 2023, when stocks returned 26%, it’s easy to become complacent, extrapolate good performance, and take on additional risks that may not be appropriate. The reverse was true in 2022 when stocks declined 18%, and, as we have discussed, seemingly everyone was predicting rockier times ahead in 2023. But a year is just a moment in time. Our lives are measured in decades, and the plans we make often span generations or include indefinite-lived causes or institutions. In this sense, resisting the urge to make bold forecasts for the next year or, even worse, acting on such forecasts is the surest way to help our clients accomplish their financial goals and stay focused on long-term outcomes, which is what actually matters.
[1] Personal Consumption Expenditures excluding Food and Energy
[2] References to US stocks, the stock market, or the market or the returns of these are represented by the S&P 500 Total Return Index.
[3] Per Bloomberg
[4] Represented by the MSCI EAFE Net Index
DISCLOSURES
Fees: Gross-of-fees returns shown incorporate the effects of all realized and unrealized gains and losses and the receipt, though not necessarily the direct investment of, all dividends and income. Net-of-fees returns shown are supplemental to the Core Equity Wrap Composite shown above. They are calculated by deducting the transaction cost of 0.10% and a portion of the total wrap fee designated as Kovitz’ management fee, which is 0.35% of assets per annum, from the gross return. The total wrap fee applicable to a particular client is dependent on the fees charged by the client’s financial advisor under the RBC wrap program. Composite Net-of-fees returns are calculated by deducting the highest, generally applicable wrap fee, which includes all charges for trading costs, investment management, administration, and custody, of 2.0% of assets per annum, less the portion previously designated for trading expenses, from the gross return. The total wrap fee applicable to a particular client is dependent on the fees charged by the client’s financial advisor and the applicable wrap sponsor. Such fees are negotiable and do not represent the experience of any Kovitz client. Gross-of-fees returns are presented before the deduction of management fees, but after the deduction of the portion of the wrap fee designated for trading expenses. Current wrap fees can theoretically range from 1.0% to 3.0% of assets per annum.
Prior to January 1, 2010, the Composite included the performance of assets that had been “carved out” of multiple asset class portfolios. When calculating performance, a hypothetical cash balance for each month was allocated to the carve-out on a pro-rata basis relative to the portion of each portfolio’s assets that comprised the carved out asset class. Beginning January 1, 2010, changes in the GIPS standards caused the Composite to be redefined and all carve-outs to be removed from the Composite. Carve-outs formerly included in the Composite continue to be managed in the same manner as they were before being removed from the Composite.
Definition of The Firm: Kovitz Investment Group Partners, LLC (Kovitz) is an investment adviser registered with the Securities Exchange Commission under the Investment Advisers Act of 1940 that provides investment management services to individual and institutional clients. From October 1, 2003 to December 31, 2015, the Firm was defined as Kovitz Investment Group, LLC. Effective January 1, 2016, Kovitz Investment Group, LLC underwent an organizational change and all persons responsible for portfolio management became employees of Kovitz. From January 1, 1997 to September 30, 2003, all persons responsible for portfolio management comprised the Kovitz Group, an independent division of Rothschild Investment Corp (Rothschild).
Composite Definition: The Core Equity Wrap Composite includes all fee-paying, discretionary portfolios, including portfolios managed under a relationship with a wrap sponsor, managed to the Kovitz Core Equity strategy. The Kovitz Core Equity strategy utilizes a private owner mentality to purchase equity securities issued by companies with durable competitive advantages and strong balance sheets that are trading at a significant discount to their intrinsic value. The goal of this strategy is to maximize long-term total return. The inception date for this composite is January 1, 1997, and the Composite was created on June 1, 2014. The minimum portfolio size to be included in the Composite is $250,000 until December 31, 2021. Thereafter, the strategy minimum was raised to $1 million. The benchmark is the S&P 500 index.
The benchmark for the Composite is the S&P 500 Index. The S&P 500 Index is composed of 500 leading companies in the United States, covers approximately 75% of the market capitalization of U.S. equities, and serves as a proxy for the total market. The S&P 500 Index returns do not include the effect of transaction costs or fees and assume reinvestment of dividends into the index.
GIPS: Kovitz Investment Group Partners, LLC (Kovitz) claims compliance with the Global Investment Performance Standards (GIPS®) and has prepared and presented this report in compliance with the GIPS standards. Kovitz has been independently verified for the periods January 1, 1997 through December 31, 2022. The verification report is available upon request. A firm that claims compliance with the GIPS standards must establish policies and procedures for complying with all the applicable requirements of the GIPS standards. Verification provides assurance on whether the firm’s policies and procedures related to composite and pooled fund maintenance, as well as the calculation, presentation, and distribution of performance, have been designed in compliance with the GIPS standards and have been implemented on a firm-wide basis. Verification does not provide assurance on the accuracy of any specific performance report. GIPS® is a registered trademark of CFA Institute. CFA Institute does not endorse or promote this organization, nor does it warrant the accuracy or quality of the content contained herein.
Valuations are computed and performance is reported in U.S. dollars. The measure of internal dispersion presented above is an asset-weighted standard deviation. The three year standard deviation presented above is calculated using monthly net-of-fees returns. The three year standard deviation is not presented when less than 36 months of returns are available. The risk measures, unless otherwise noted, are calculated gross of fees. A complete listing of composite descriptions and policies for valuing portfolios, calculating performance, and preparing GIPS reports are available on request. The composite includes accounts that do not pay trading fees.
The description of products, services, and performance results of Kovitz contained herein is not an offering or a solicitation of any kind. Past performance is not an indication of future results. Securities investments are subject to risk and may lose value.