The Hardest Part of Market Timing is Getting the Timing Right
The Q1 Bear Market
Short-term market movements, especially in the downward direction, are sure to generate plenty of headlines and evoke some level of fear and panic among most investors. It all seemed justified this time around, as it usually does, during the Bear Market in the first quarter of this year, a result of fallout related to the spread of COVID-19 around the world. The speed of the decline was among the highest in market history. From the S&P 500 index’s peak on February 19, it took just eight calendar days for the index to enter correction territory (-10% or more) and 22 days to enter a Bear Market (-20% or more), while the index hit the bottom (-34%) after just 33 days. Front of mind, once again, was the avoidance of downside.
Market Timing
It is understandable for an investor to want to avoid downside, and in hindsight, the signs of an impending Bear Market are usually obvious. But predicting the future is not always so obvious, and in the midst of the downturn, we were again pondering our ability—or inability— to time the market. The challenge, however, is how to measure the value of avoiding the downside. Perhaps the most common method is to compare investing a fixed amount over time, known as Dollar-Cost Averaging, to investing all at once, also known as Lump Sum Investing. While the Dollar-Cost Averaging vs. Lump Sum Investing comparison is simple to calculate, we do not think it does a realistic job capturing a more common type of investor who earns an income and systematically saves a portion of those earnings. The solution was to create a simple “Buy the Dip” strategy for this exercise, which incorporates frequent cash contributions to a portfolio, similar to the way 401(k) or other retirement accounts work.
A Lot of Effort for Little Upside
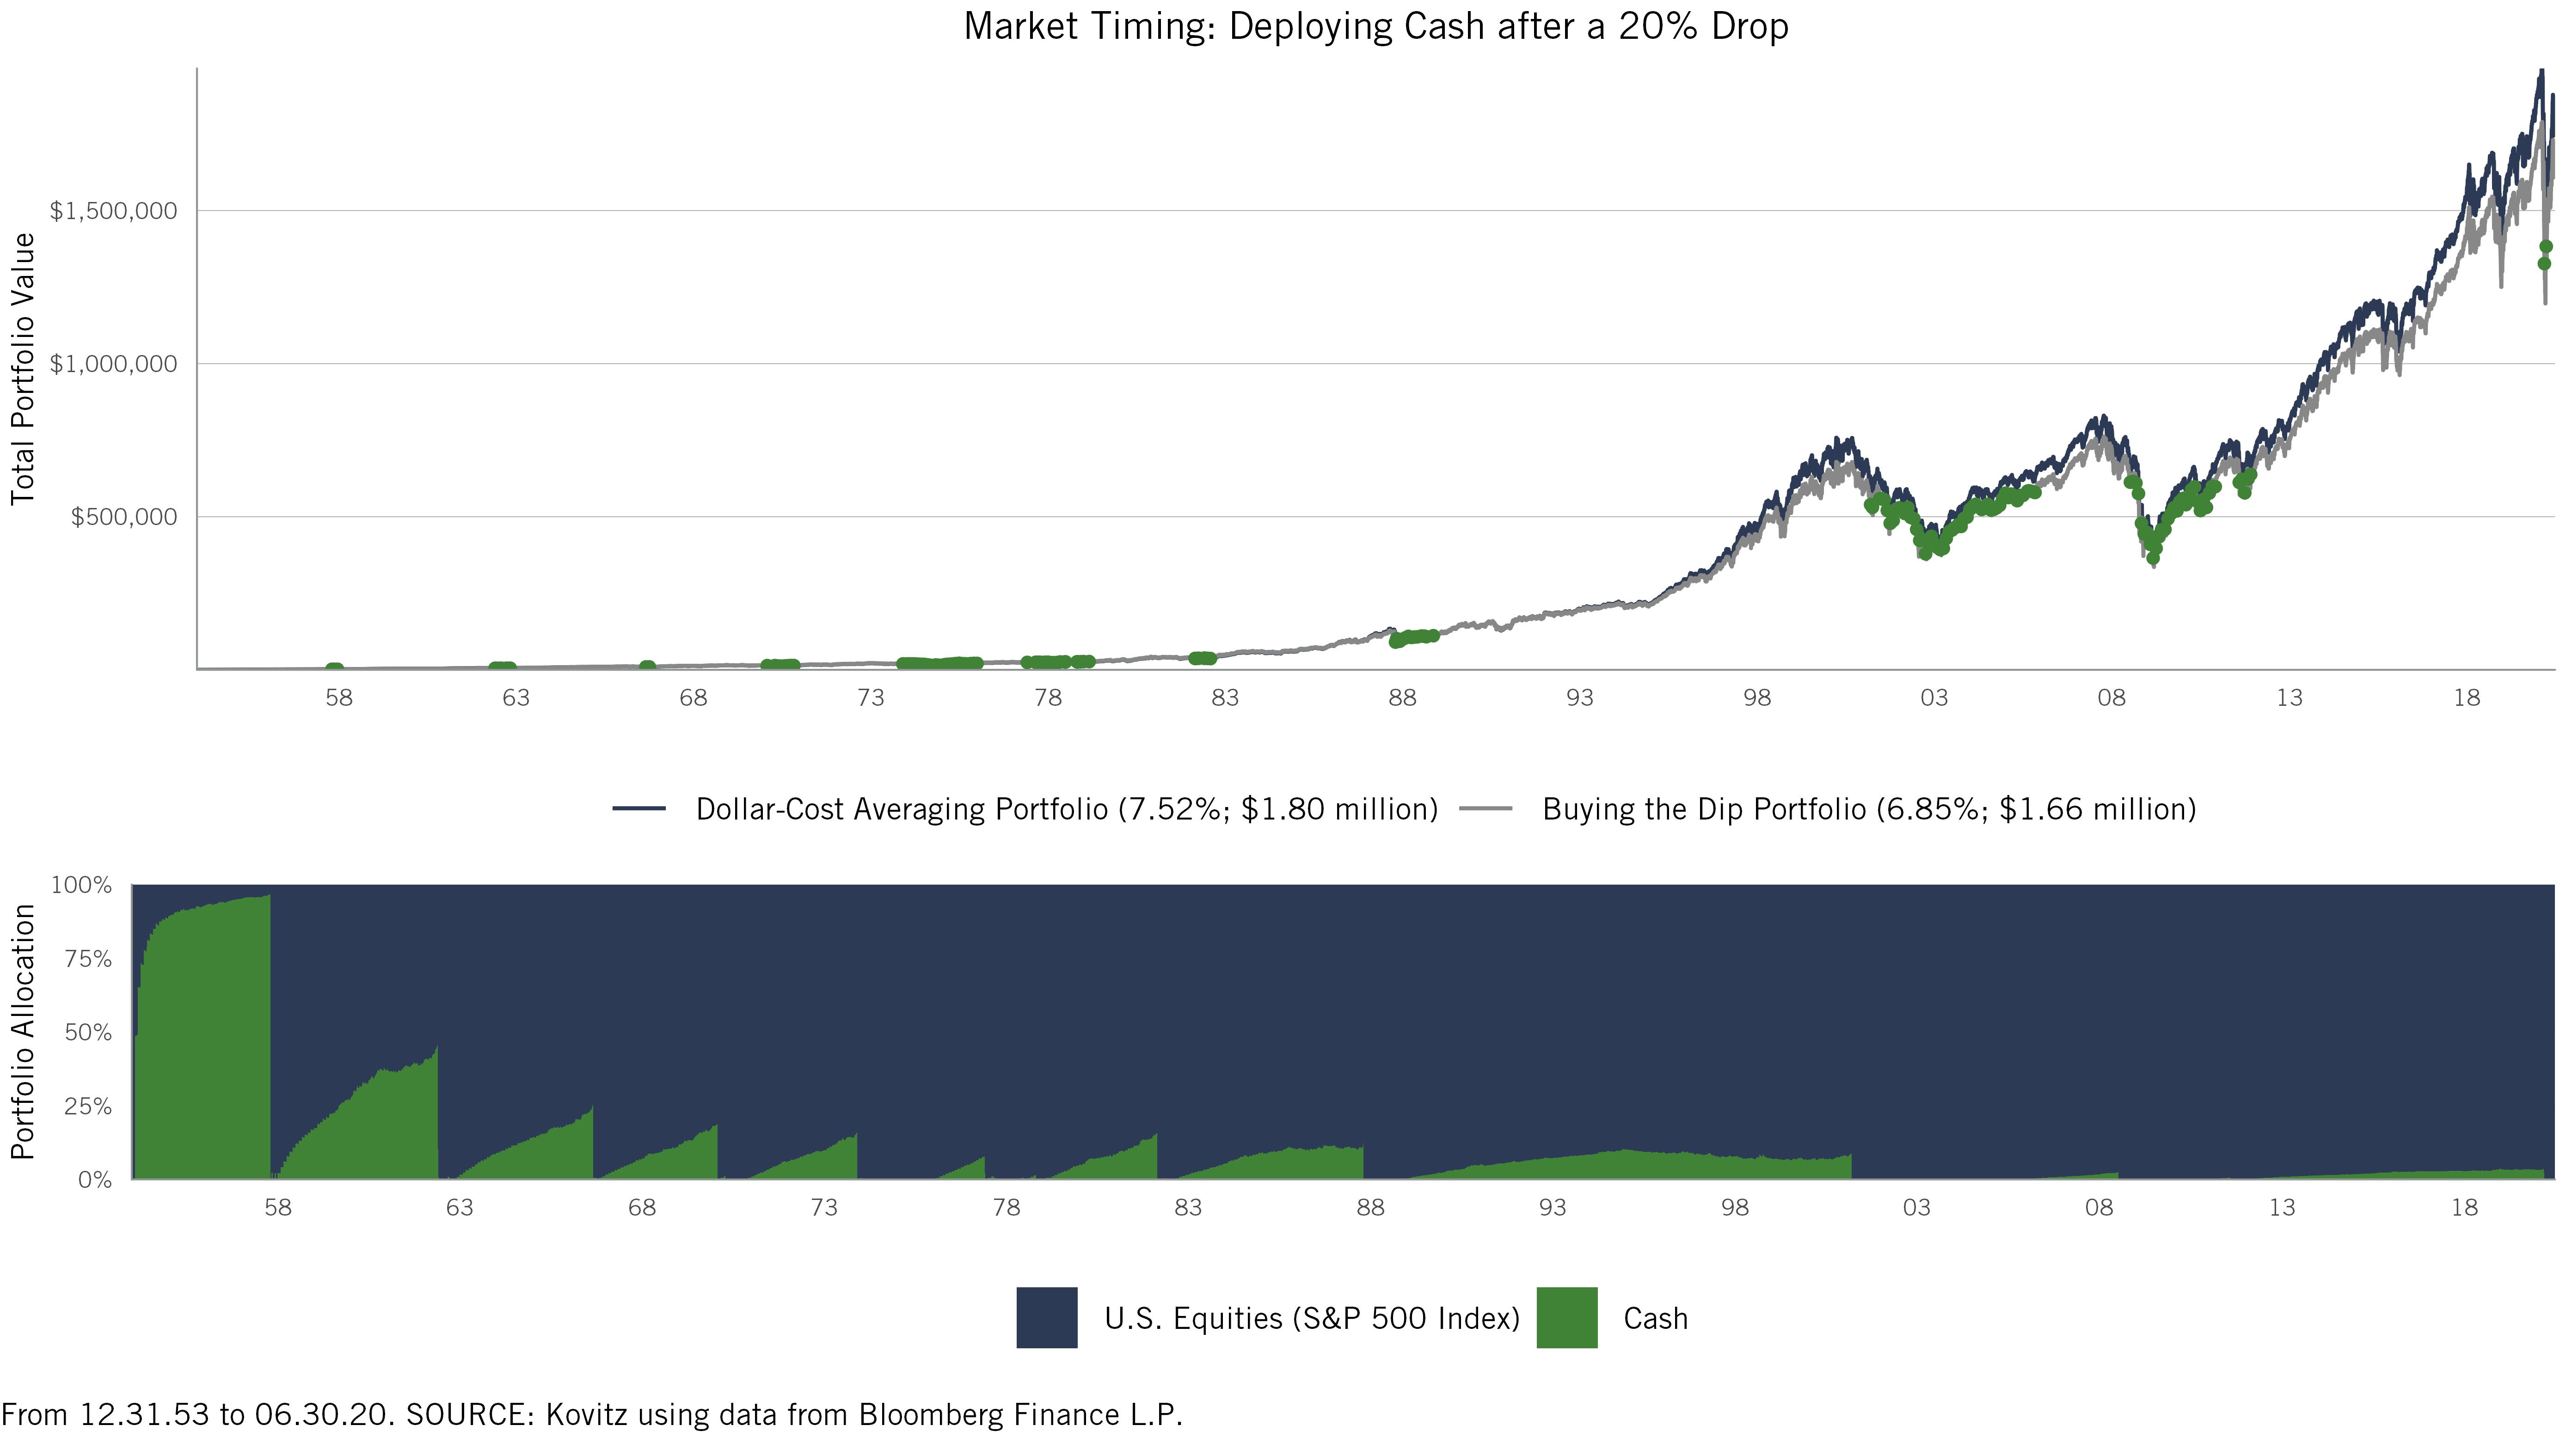
Using the Census Bureau’s U.S. Median Family Income index beginning in 1953, we assumed that an investor would have saved 10% of their income each year. Although the percentage remained uniform throughout, the dollar value of each contribution inevitably grew along with the overall median household income. For the Dollar-Cost Averaging portfolio, the investor immediately invested the entire contribution at the end of each month. For the “Buy the Dip” portfolio, the investor kept the cash on the sidelines until the S&P 500 was a set percentage below the index’s prior peak. Cash in the “Buy the Dip” portfolio was allowed to build up until the S&P dropped below the threshold, in which case the amount held on the sidelines was invested the following day, not needing to wait until the end of the month to put the funds to work. The monthly contribution continued to be invested as long as the S&P was below its prior-peak threshold. Once the S&P recovered to the threshold amount or above, the cash portion of the portfolio resumed its build up.
The result, charted below, shows some long periods of cash accumulation, with the relatively uncommon (every four years or so) Bear Markets causing the cash to be put to work in the “Buy the Dip” portfolio. The green dots in the top half of the chart represent days where accumulated cash was put to work, while the bottom allocation table shows the cash build up as a percentage of the overall portfolio. The Dollar-Cost Averaging portfolio is steady and unbothered by market gyrations, resulting in outperformance of the “Buy the Dip” portfolio by 67 basis points (0.67%) annually, which translates to an extra $141,000 at the end of June. We think it is a healthy margin of victory for a portfolio that started with just $35 in 1953!
It could be argued that 20% drawdowns are too infrequent, and market timers would be waiting for a more-common 10% drawdown (every year or so).
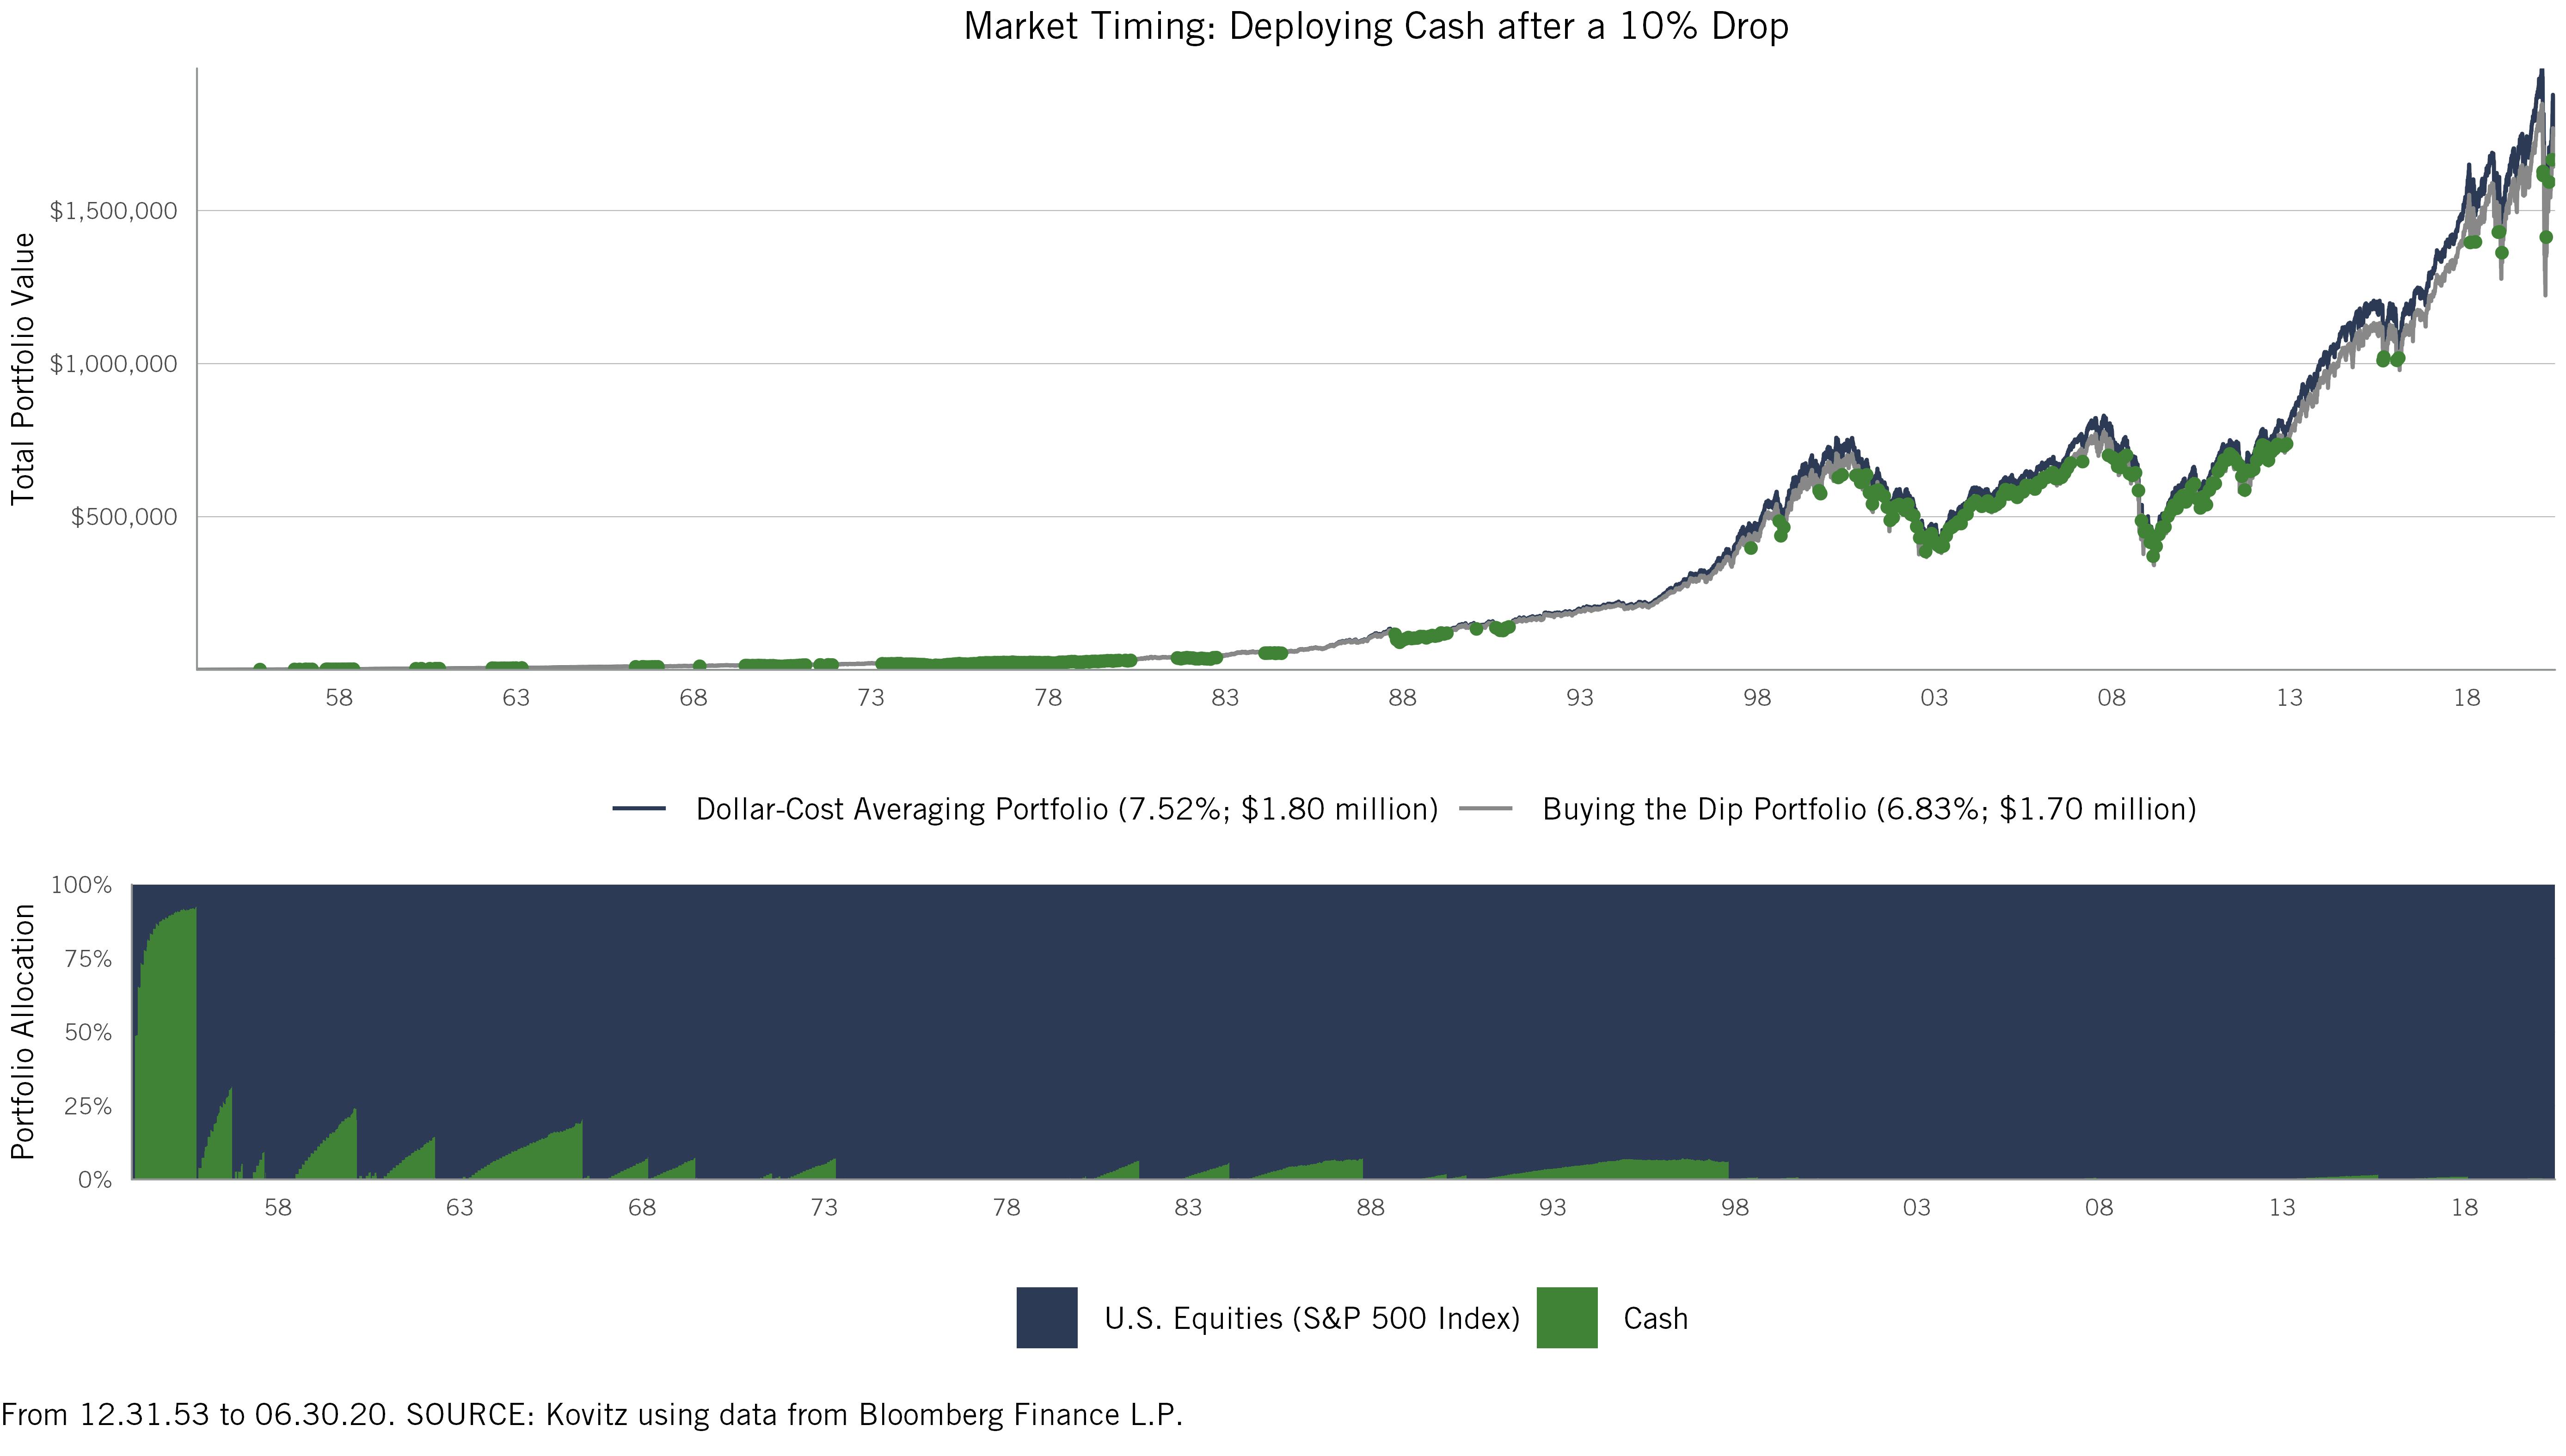
Unfortunately for the wayward market timer, that strategy also performed poorly. The performance gap widened a little bit due to poorer market timing, while the overall portfolio value gap shrunk from $141,000 to $105,000.
Staying on the Path
We realize that both the Dollar-Cost Averaging portfolio and the “Buy the Dip” portfolio would have made money over the period, and the “Buy the Dip” portfolio worth $1.63 million is still very respectable. However, constantly keeping tabs on a portfolio is a lot of work and the Individual Investor Asset Allocation Survey conducted by the American Association of Individual Investors (AAII) shows that most investors would have been unlikely to deploy cash in the dips anyway. The survey shows that individual investors have had an average 23% allocation to cash since 1997. In the most recent Bear Market, the average cash allocation actually increased from 13.8% in January to 26.1% in March, precisely when that cash should have been put to work. The story was not much different in other recent Bear Markets, with cash accounting for nearly 45% in March 2009, 30% in September 2001 and 38.6% in October 2002.
It should come as little surprise that we remain less focused on getting the timing right and laser-focused on the long-term potential for our broadly diversified portfolios. We believe that there are plenty of ways to limit downside in portfolios, many of them fairly simple to implement, but trying to time the market is not one of them. As always, at Kovitz we partner with our clients to help guide them through uncertain times to stay the course. We recognize that investing may be challenging, stressful and frustrating, when it should be rewarding. We bring decades of experience in a variety of market environments and are always Guided by Value.
Posted by
Kovitz